
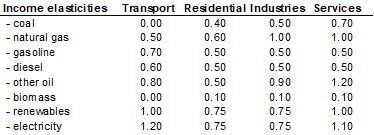
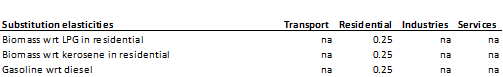
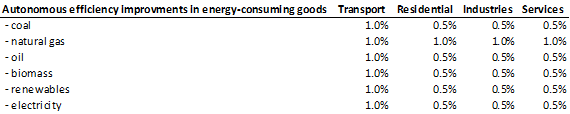
 The exogenous time trend or autonomous efficiency improvement is set based on IEA’s data and experts’ judgment. Values are different across sectors and fuels. See the caveats section.
3.4.4.1.2 Primary Data Sources
Power sector data components are organized into two primary methodological approaches:
- Derived Data: Components directly extracted, or derived, from energy consumption capacity datasets. These provide empirical foundations based on operational data.
- Study-Based Data: Components sourced from studies, research publications, and institutional assessments.
CPAT power models draw from the following key data sources (summarized in Table 2):
- Main Technoeconomic Characteristics: Global data is derived from the CCDR EEX Methodology Note – Energy Transition Analysis FY24 (CCDR-EEX) , as well as Way et al., (2022) and the Global and National Energy Systems Techno-Economic (GNESTE) database . National data is derived from IRENASTAT (IRENA) , GNESTE and BloombergNEF (BNEF).
- Time Evolution of CapEx: Data is derived from the CCDR-EEX (using IEA scenarios).
- Decommissioning and Transmission Costs: Decommissioning data is derived from three studies: Raimi (2017) , the World Nuclear Association (2023) , and the Water Power & Dam (2009) . Transmission data us derived from Andrade and Baldick (2017) .
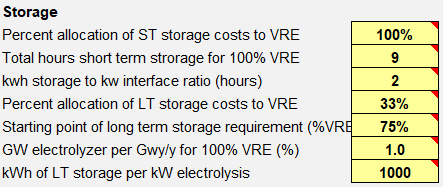
- Storage: Data derived from Bogdanov et al. (2019) is used.
- Installed Capacity: Current and forecast data are derived from IRENA .
- Planned Retirement of Power Plants: Data from the Global Coal Plant Tracker is used.
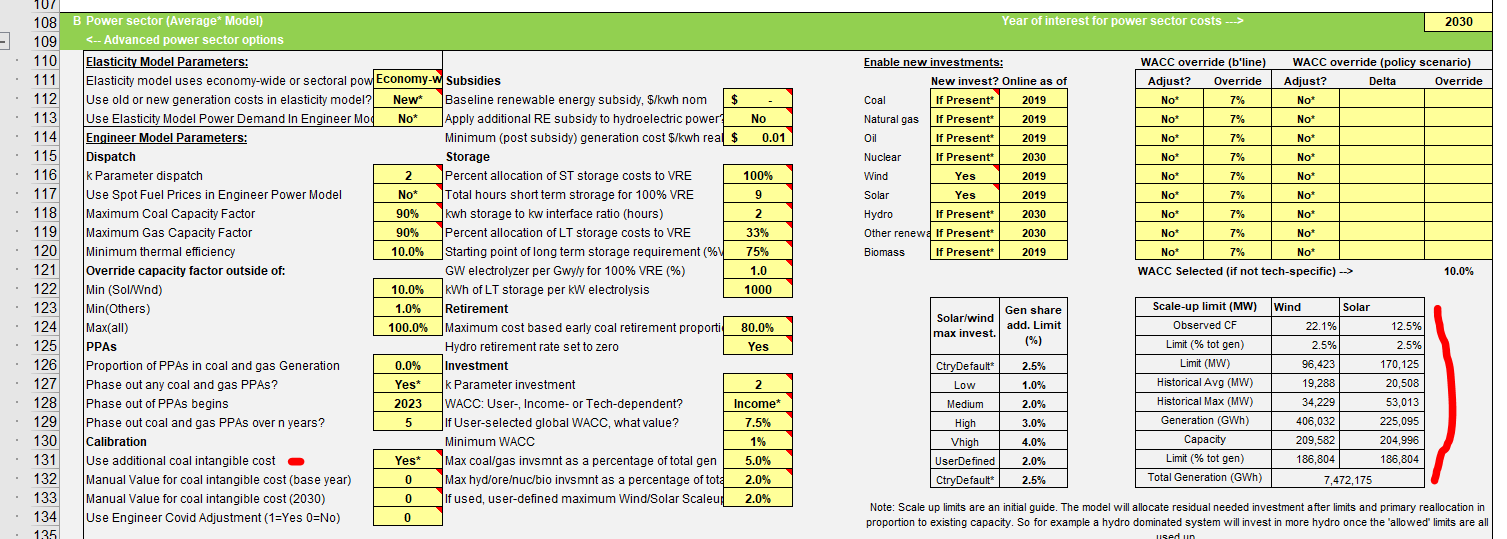
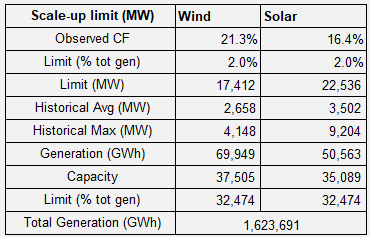
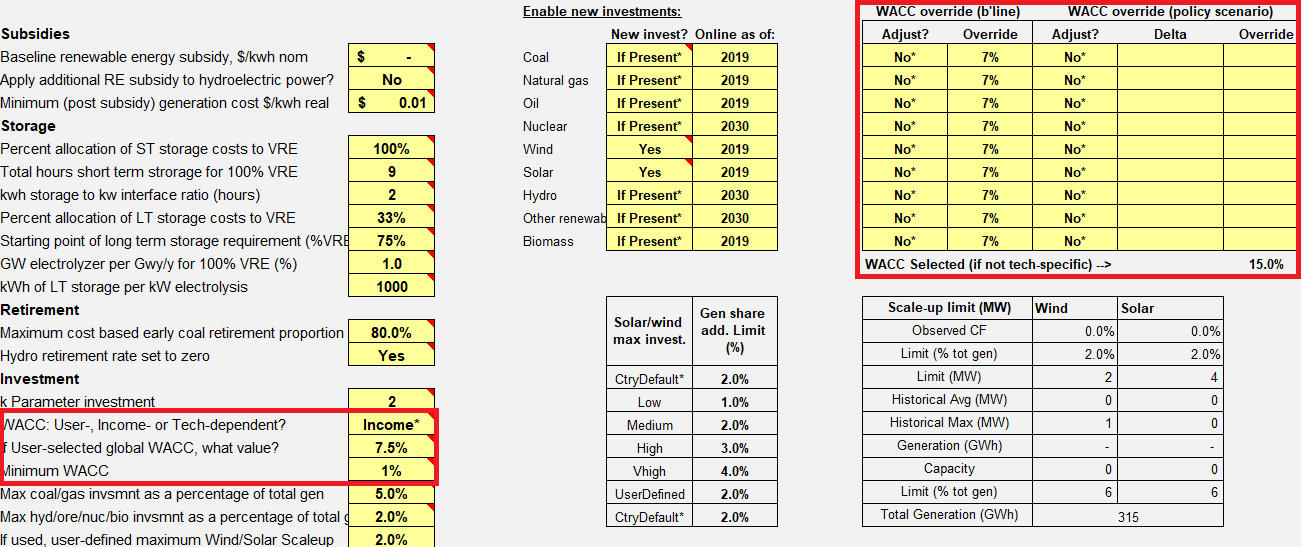
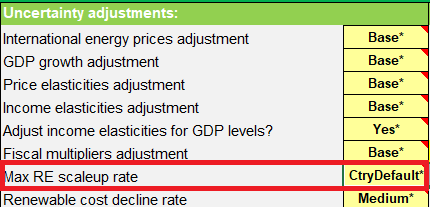
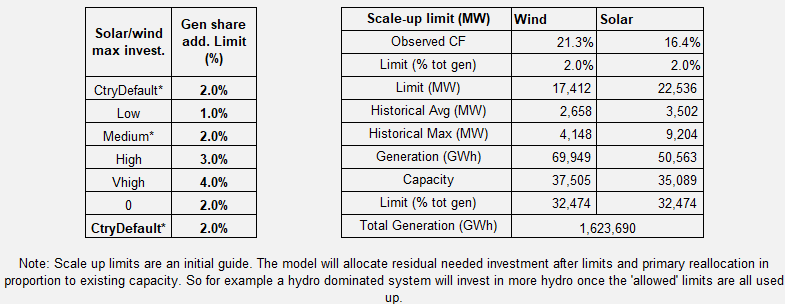
- Maximum RE Scale-Up Rate: Assumptions are used. We hope to revise these as part of the review of the investment equation.
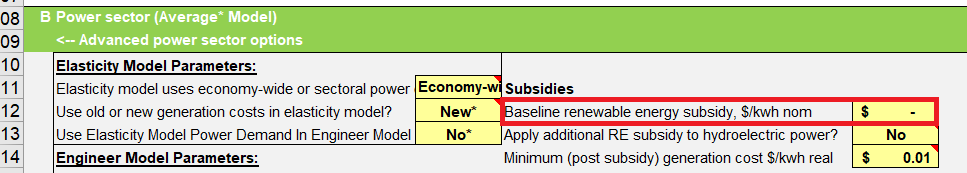
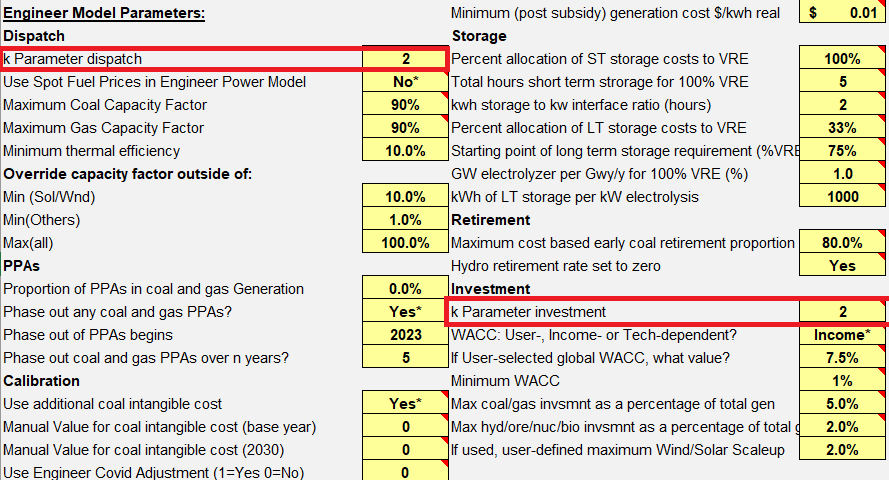
- WACC: A mixed approach is used, deriving data from Damodaran (2025) and Steffen (2020) .
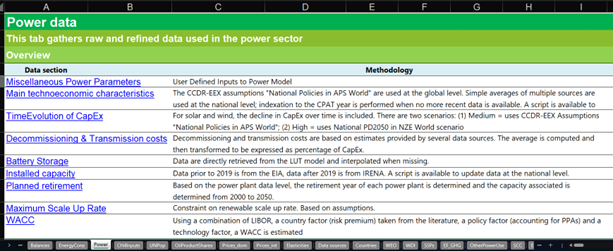
| Data Section | Methodology | Unit | Data Level | Data Source |
|---|---|---|---|---|
| Main Technoeconomic Characteristics | The CCDR-EEX assumptions “National Policies in APS World” are used. | CapEx, variable and fixed OpEx in USD/kW; Capacity Factor, WACC and efficiency in %; Total lifetime in years | Global | CCDR-EEX (WBG), Way et al., 2022, GNESTE |
| Simple averages of multiple sources are used; indexation to the CPAT year is performed when no more recent data is available. A script is available to update data at the country-level. | Country | IRENA (Red), GNESTE (Purple), BNEF (Green) | ||
| Time Evolution of CapEx | For solar and wind, the decline in CapEx over time is included. There are two scenarios: (1) Medium = uses CCDR-EEX Assumptions “National Policies in APS World”; (2) High = uses National PD2050 in NZE World scenario | Index (base year: 2021) | Global | CCDR-EEX (WBG) |
| Decommissioning & Transmission costs | Decommissioning and transmission costs are based on estimates provided by several data sources. The average is computed and then transformed to be expressed as percentage of CapEx. NB: Transmission costs are not currently used in CPAT. | Percentage of CapEx | Global | Decommissioning costs (Raimi, 2017; WNA, 2023; Water Power & Dam, 2009) & Transmission costs (Andrade & Baldick, 2017) |
| Storage | Data are directly retrieved from the LUT model and interpolated when missing. | CapEx, fixed and variable OpEx in USD/kWh, lifetime in years | Global | LUT model (Bogdanov et al., 2019) |
| Installed capacity | Data prior to 2019 is from the EIA, data after 2019 is from IRENA. A script is available to update data at the national level. | Installed capacity in MW | Country | EIA, IRENA |
| Planned retirement | Based on power plant data, the retirement year of each power plant is determined and the capacity associated is determined from 2000 to 2050. | MW per year | Country | Coal Power Plant tracker |
| Maximum Scale Up Rate | Constraint on renewable scale up rate. Based on assumptions. | % | Country | Assumption |
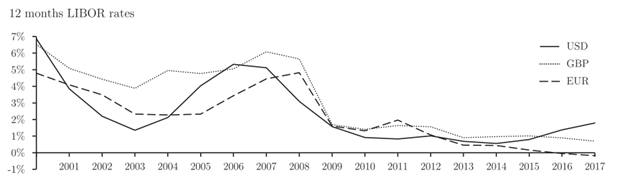
| WACC | Using a combination of LIBOR, a country factor (risk premium) taken from the literature, a policy factor (accounting for PPAs) and a technology factor, a WACC is estimated | % | Country | Damodaran, 2023; Steffen, 2020 |